Sidebar
Table of Contents
Monitoring system use
On the main page, you can see a chart that indicates recent system use.
PMA.core provides access to its logging system and presents detailed and precise information and statistics about the server's usage. This is done using PMA.core's internal logging system without using any external analytics library like Google Analytics

The home page of the admin user interface shows an overview of the activities performed on the PMA.core server at realtime:
- Total Users: the total number of users
- Active Sessions: the number of logged in users
- Forms: the total number of forms
- Filled Forms: the total number of data submitted to forms
On the right hand side you can see the activity on the server for last month
- The number of users active every day of the last month
- The number of slides viewed every day of the last month
Historic use
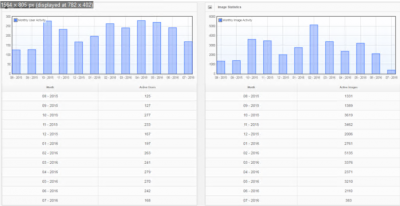
Clicking on the chart brings up a historical (since system inception) chart of both consulted slides and user sessions (on a monthly basis):
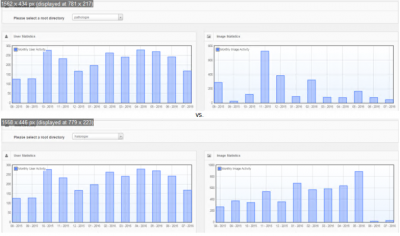
You can limit the chart to show the historical load and access to just one particular root-directory:
On the monthly statistics page you can generate monthly reports for the server's activity over a specified years. These reports include the number of users active each month and the number of slides viewed each month.
Finally you can also filter the results to a specific Virtual Root directory to further fine tune the reports you want.
Other resources
See also our sections on performance and log files.